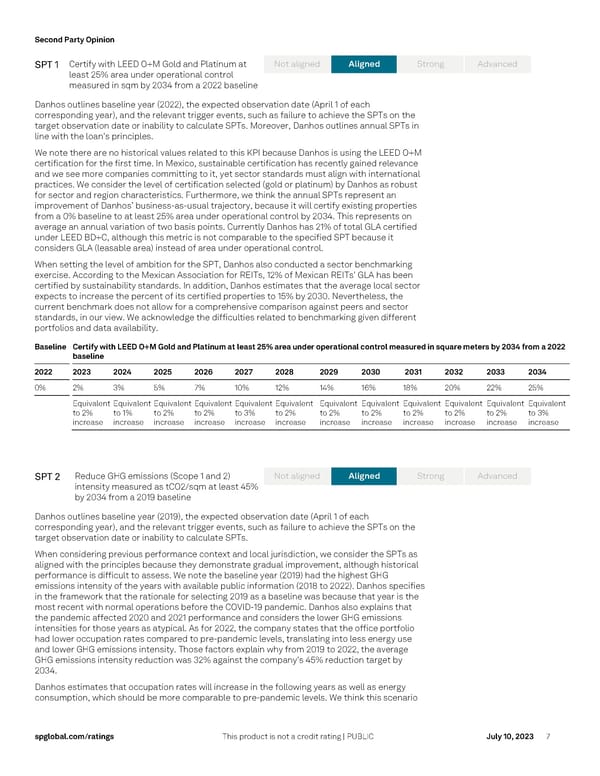
Second Party Opinion s pglobal.com/ ratings This product is not a credit rating | PUBLIC July 10, 2023 7 SPT 1 Certify with LEED O+M Gold and Platinum at least 25% area under operational control measured in sqm by 2034 from a 2022 baseline Danhos outlines baseline year (2022), the expected observation date (April 1 of each corresponding year), and the relevant trigger events, such as failure to achieve the SPT s on the target observation date or inability to calculate SPT s. Moreover, Danhos outlines annual SPTs in line with the loan's principles. We note there are no historical values related to this KPI because Danhos is using the LEED O+M certification for the first time . In Mexico, sustainable certification has recently gained relevance and we see more companies committing to it, yet sector standards must align with international practices. We consider the level of certification selected (gold or platinum) by Danhos as robust for sector and region characteristics. Furthermore , we think the annual SPTs represent an improvement of Danhos’ b usiness -as -u sual trajectory , because it will certify existing properties from a 0% baseline to at least 25% area under operational control by 2034. This represents on average an annual variation of two b asis point s. Currently Danhos has 21% of total GLA certified under LEED BD+C, although this metric is not comparable to the specified SPT because it considers GLA (leasable area) instead of area under operational control . When setting the level of ambition for the SPT, Danhos also conducted a sector benchmarking exercise. According to the Mexican Association for REITs, 12% of Mexican REITs' GLA has been certified by sustainability standards . In addition, Danhos estimates that the average local sector expects to increase the percent of its certified properties to 15% by 2030. Nevertheless, the current benchmark does not allow for a comprehensive comparison against peers and sector standards , in our view . We acknowledge the difficulties related to benchmarking given different portfolios and data availability. Baseline Certify with LEED O+M Gold and Platinum at least 25% area under operational control measured in square meters by 2034 from a 2022 ba seline 2022 2023 2024 2025 2026 2027 2028 2029 2030 2031 2032 2033 2034 0% 2% 3% 5% 7% 10% 12% 14% 16% 18% 20% 22% 25% Equivalent to 2% increase Equivalent to 1% increase Equivalent to 2% increase Equivalent to 2% increase Equivalent to 3% increase Equivalent to 2% increase Equivalent to 2% increase Equivalent to 2% increase Equivalent to 2% increase Equivalent to 2% increase Equivalent to 2% increase Equivalent to 3% increase SPT 2 Reduce GHG emissions (Scope 1 and 2) intensity measured as t CO2/sqm at least 45% by 2034 from a 2019 baseline Danhos outlines baseline year (2019), the expected observation date (April 1 of each corresponding year), and the relevant trigger events, such as failure to achieve the SPT s on the target observation date or inability to calculate SPT s. When considering previous performance context and local jurisdiction, we consider the SPTs as aligned with the principles because they demonstrate gradual improvement, although historical performance is difficult to assess . We note the baseline year (2019) had the highest GHG emissions intensity of the years with available public information (201 8 to 2022). Danhos specifies in the framework that th e rationale for selecting 2019 as a baseline was because that year is the most recent with normal operations before the COVID -19 pandemic. Danhos also explains that the pandemic affected 2020 and 2021 performance and considers the low er GHG emissions intensit ies for those years as atypical. As for 2022, the company states that the office portfolio ha d lower occupation rates compared to pre- pandemic levels, translating into less energy use and lower GHG emissions intensity. Those factors explain why from 20 19 to 2022, the average GHG emissions intensity reduction was 32% against the company's 45% reduct ion target by 2034. Danhos estimates that occupation rates will increase in the following years as well as energy consumption , which should be more comparable to pre -pandemic levels. We think this scenario Aligned No t aligned St rong Ad vanced Aligned No t aligned St rong Ad vanced
 Fibra Danhos' Sustainability Linked Financing Framework Page 6 Page 8